
Click Open Location Summary Report in the upper right of the Location Performance Comparison lane to see details about the relative performance of each of your branches:
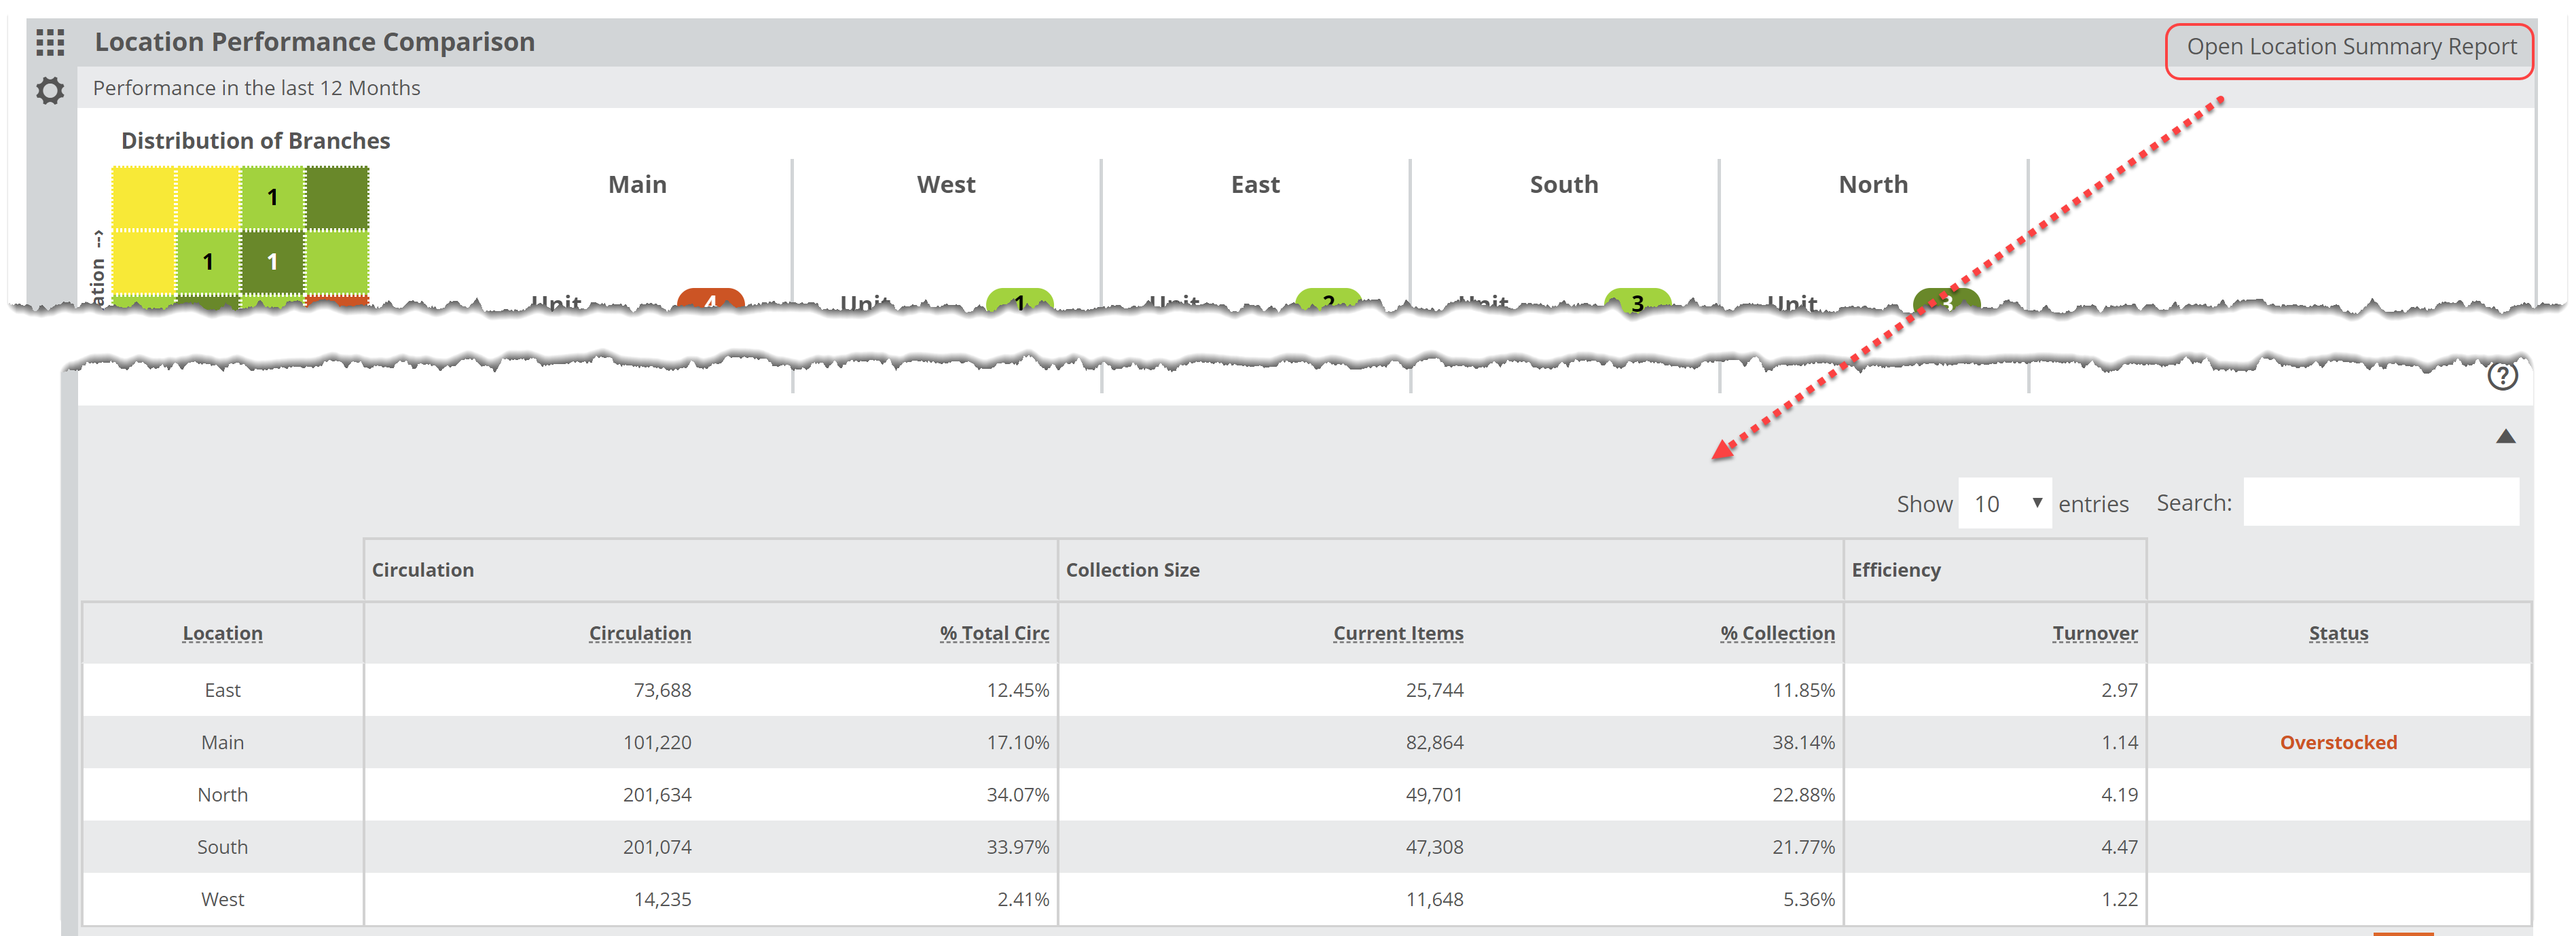
You’ll be able to see, based on the timeframe you selected and any Saved Filters you’ve set, details about the Circulation, Collection Size and Annual Turnover at each location. Let’s look at each section:
Location:
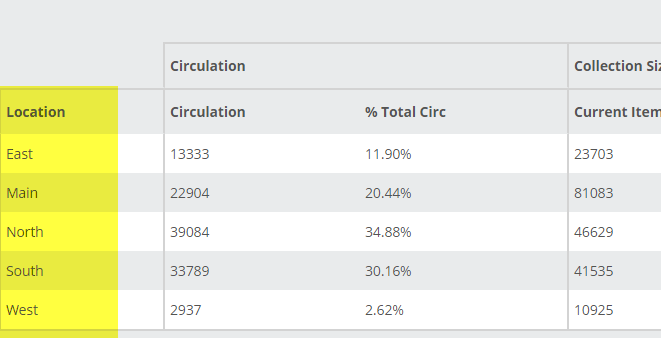
Each branch should be listed. If not, contact support@abovethetreeline.com and we can investigate.
Circulation:
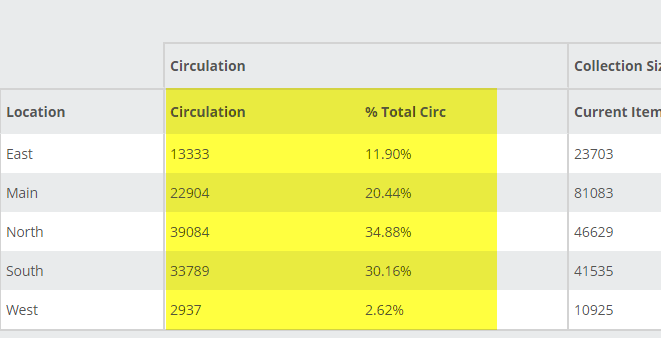
Within the selected filters, how many total copies circulated at each branch? You’ll see that number in the Circulation column. %Total Circ shows the percentage of your TOTAL circulations represented by each branch. In the image above, the West branch accounts for just 2.62% of the total circulation, while the North branch accounts for almost 35%.
Collection Size:
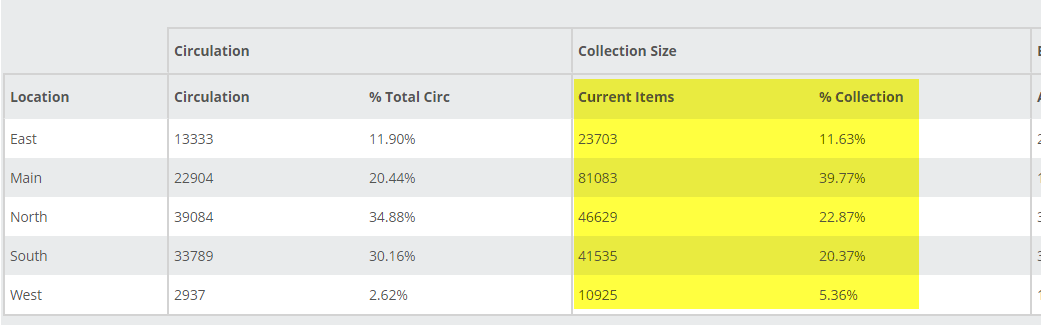
The Current Items column indicates the total number of items currently owned (again, within the confines of any filters you’ve set) at each of your branches. % Collection indicates the percentage of your total collection for which each branch is responsible. The West branch accounts for just over 5% of the total collection, while the hefty Main branch accounts for almost 40% of the total collection (but just over 20% of the total circulation).
Efficiency:
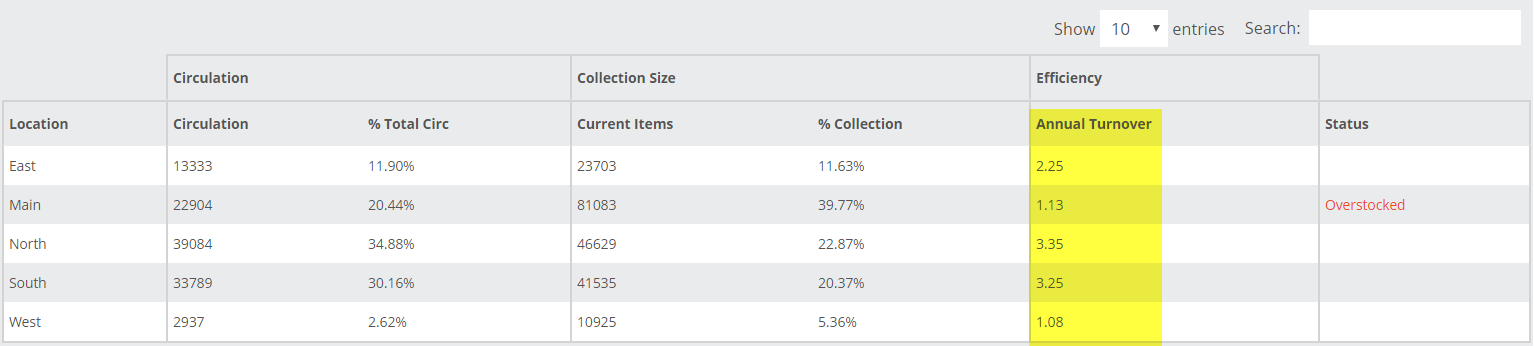 Annual Turnover indicates the number derived from the Circulation versus Holdings equation. You may have a target turn number in mind, but remember that the higher the number the better, for the most part. The North and South branches are looking pretty great in the image above.
The Status column indicates if a branch is clearly over-or-understocked. Essentially, if the Collection Size greatly outstrips the Circulation numbers, it might benefit from some weeding, and vice-versa.