
As with everywhere else in your Analytics tools, you can set a wide variety of filters to narrow down the list of titles you want to check out.
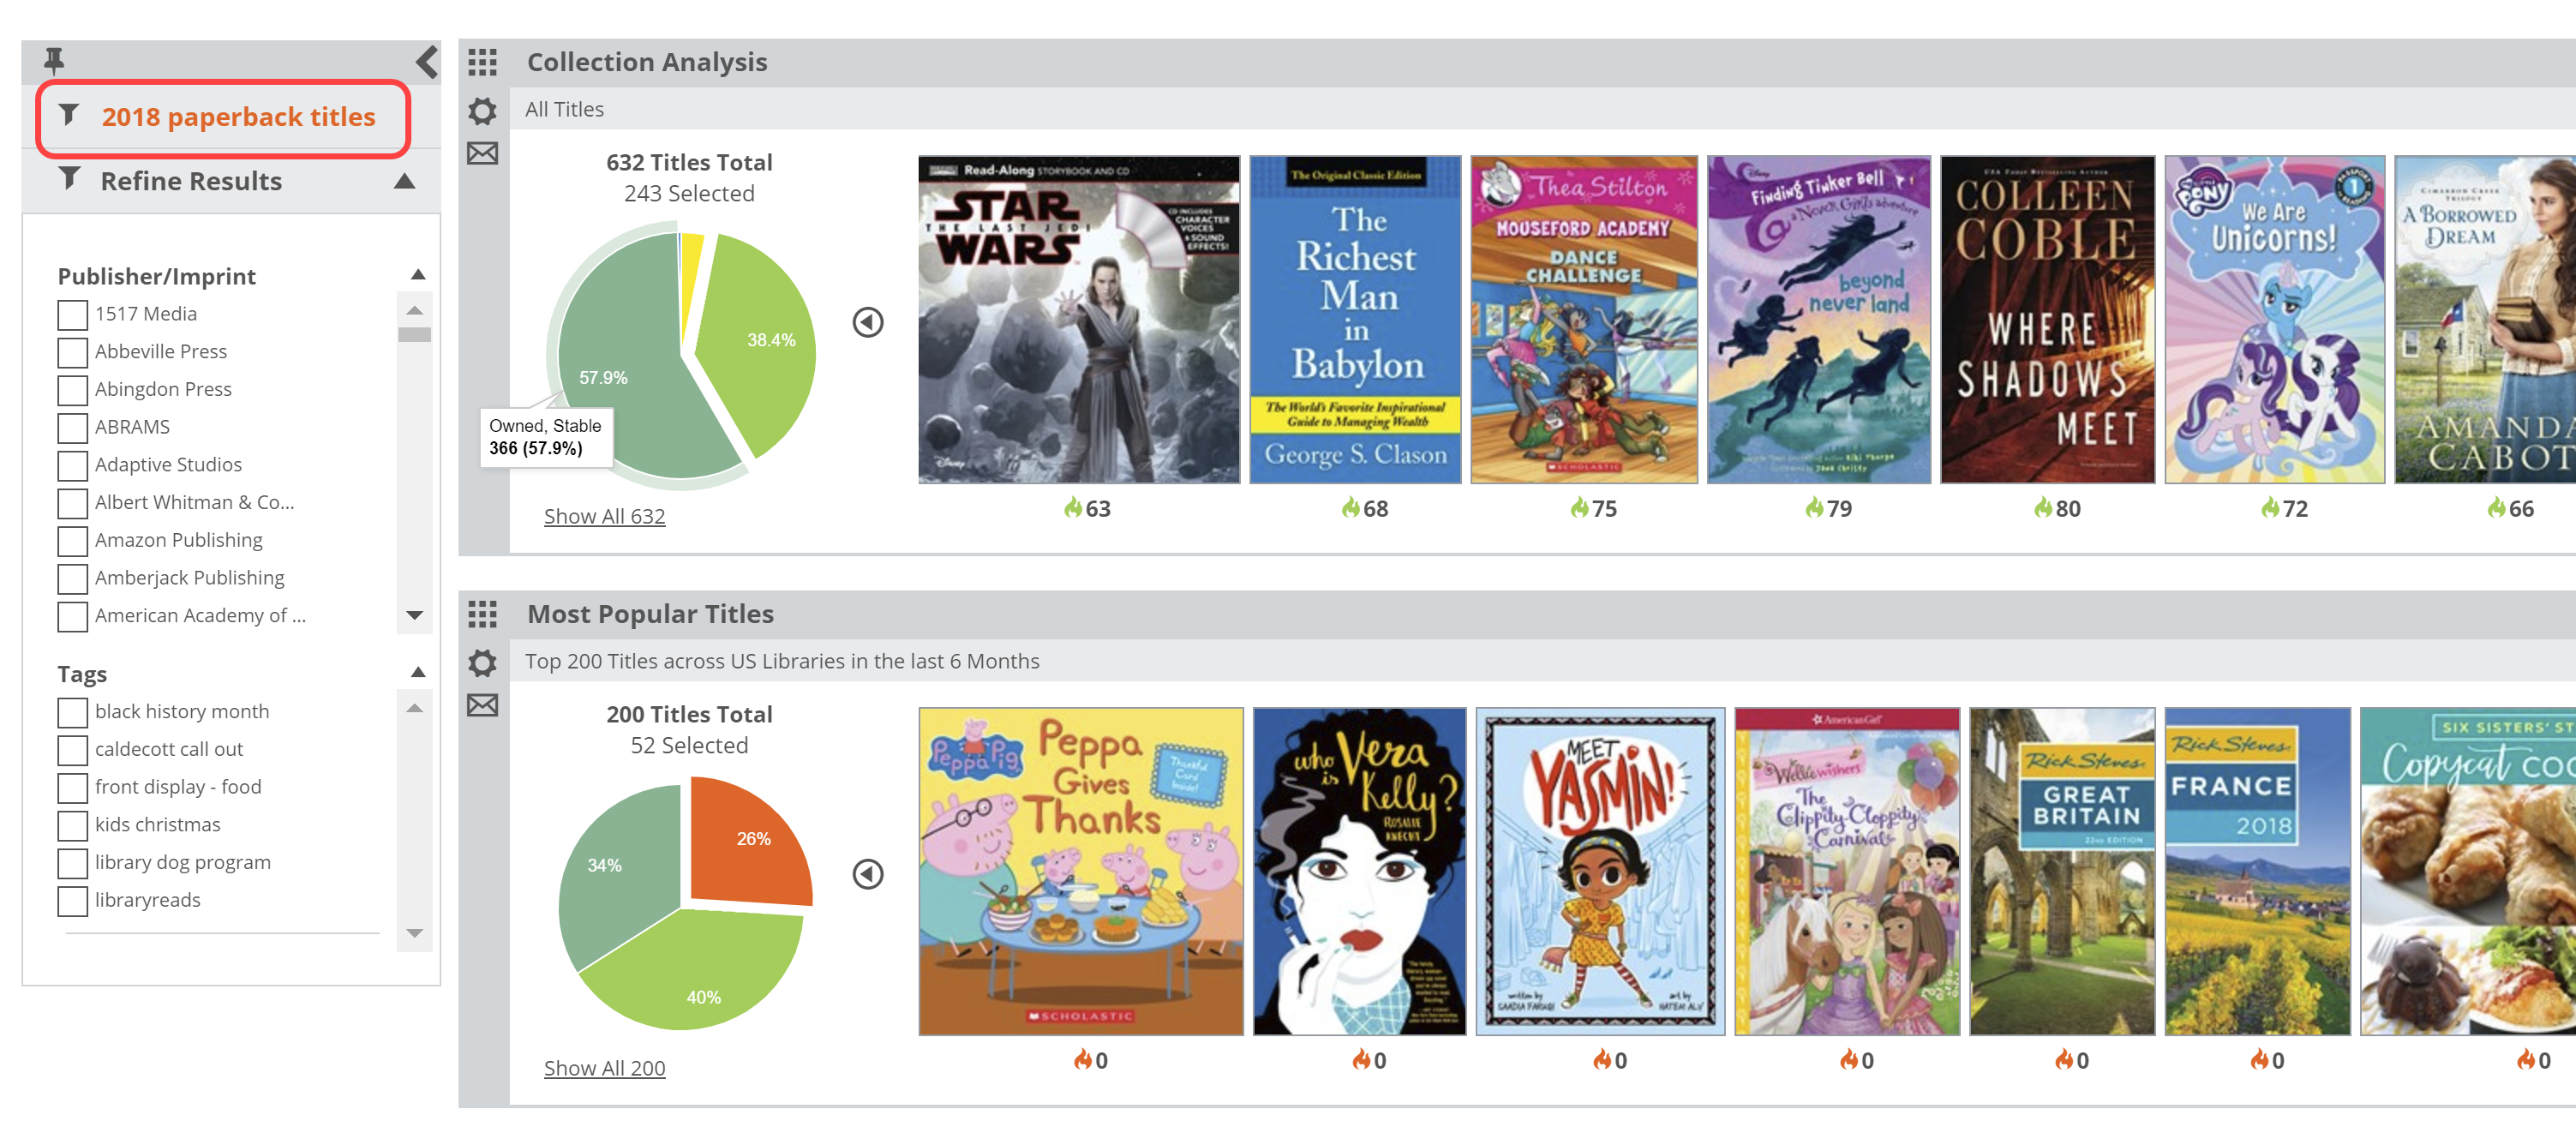
Click the drop-down link next to the description of the lane to reveal a menu in which you can set a few parameters for this graph.
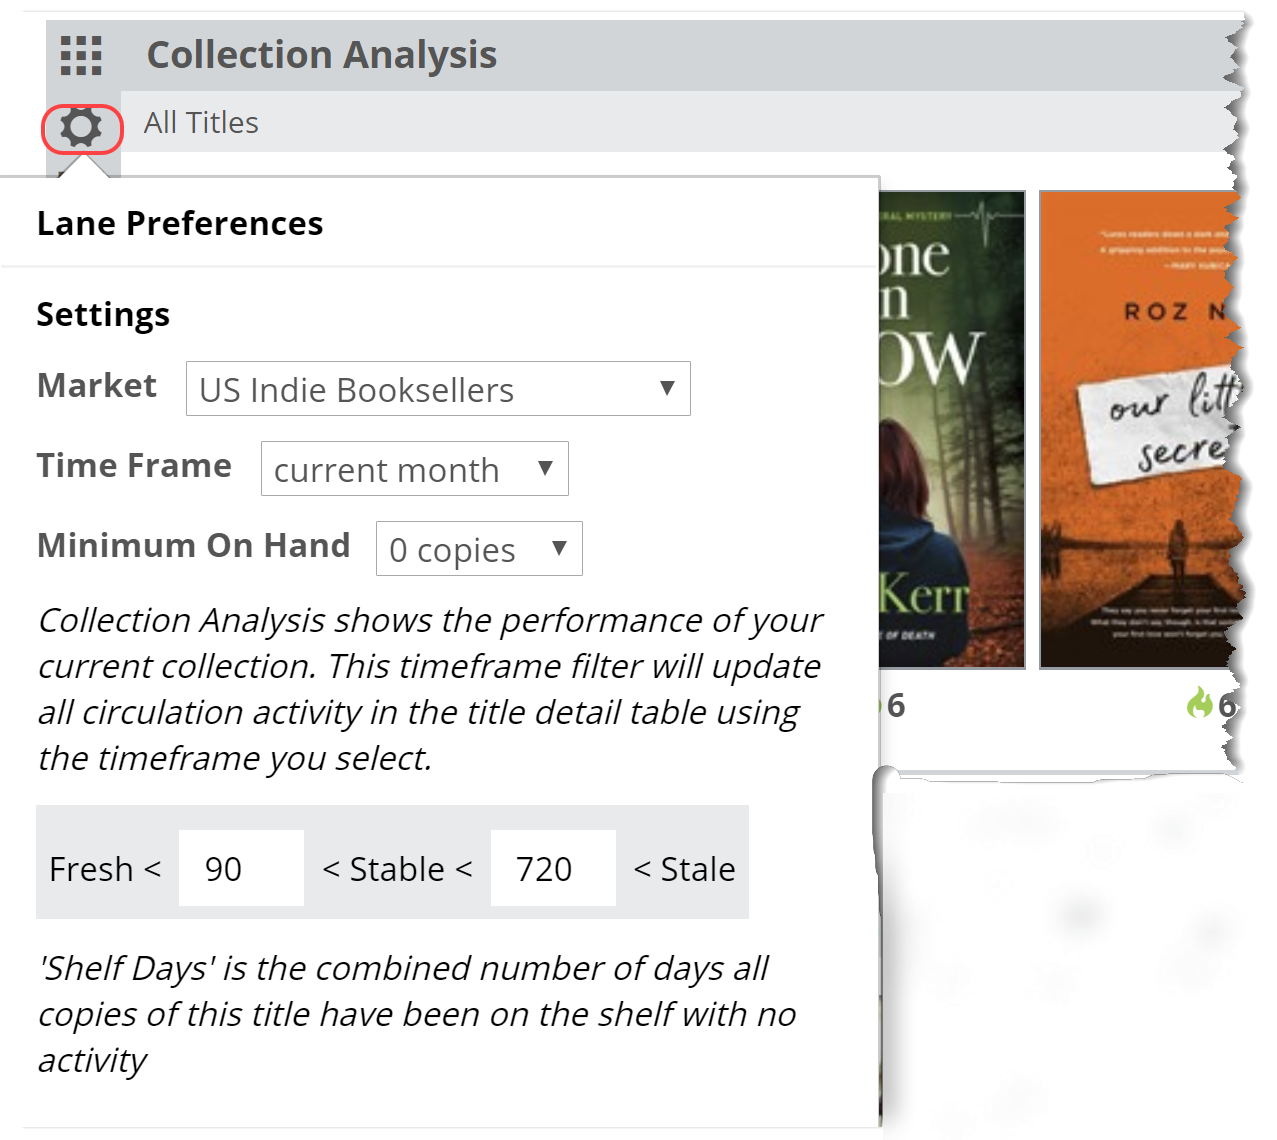
Here’s an explanation for each of your options:
Market:
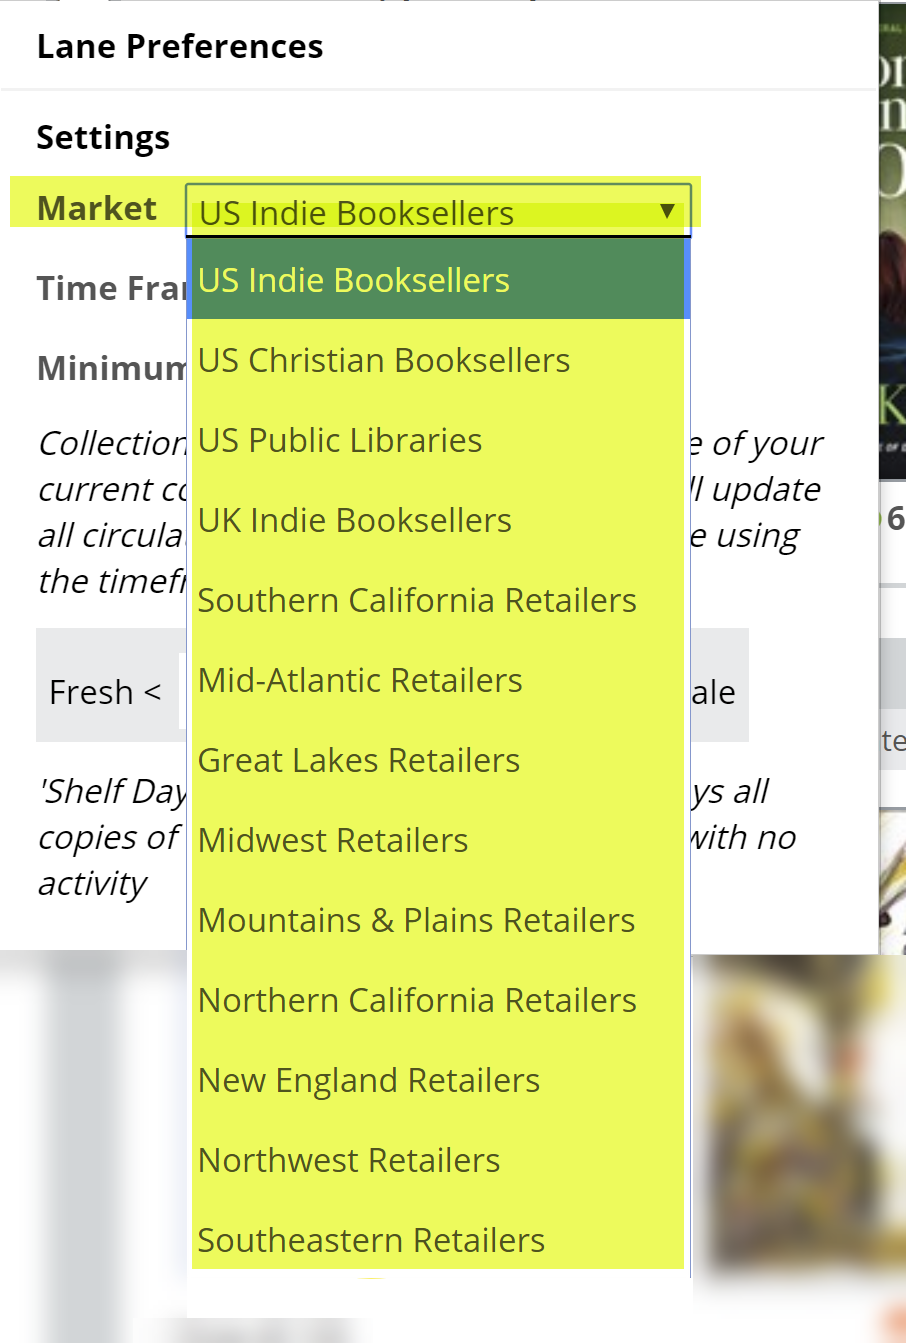
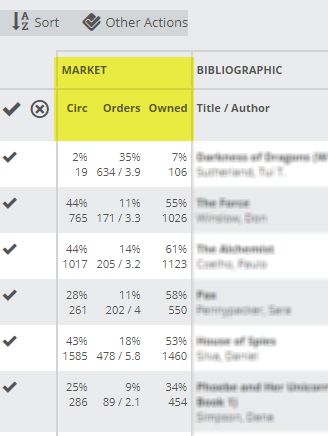
You can select to view market results for your own market, or another market’s top-selling or top-circulating titles. In this particular tool, the graph itself will not be affected by this Preference setting. The Title Detail List’s Market data will reflect this selection.
Time Frame:
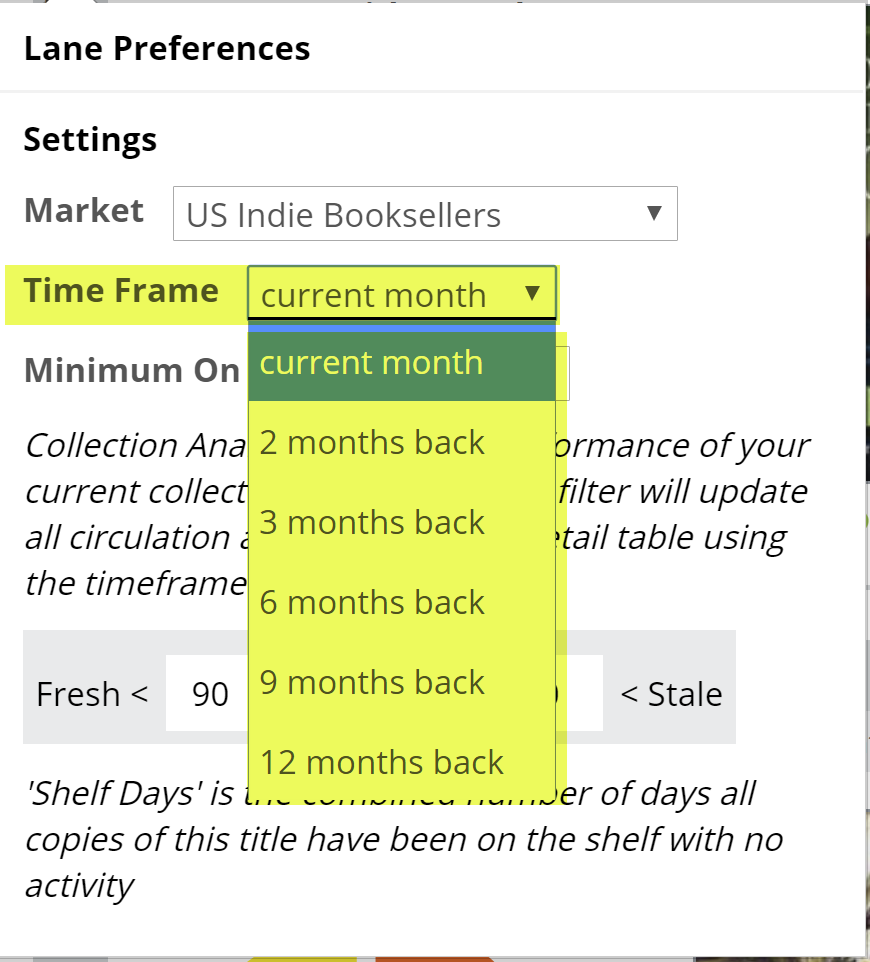
How far back would you like to look? Viewing results for 1 month back will essentially show which of your titles are hot and circulating right now. Looking farther back, like a year, will show a longer tail of activity, so to speak. Keep in mind that looking farther back will include other seasons, like the holidays, summer, etc. If you’re using this graph to generate a list of titles that should go away, looking farther back makes more sense.
Minimum on Hand:
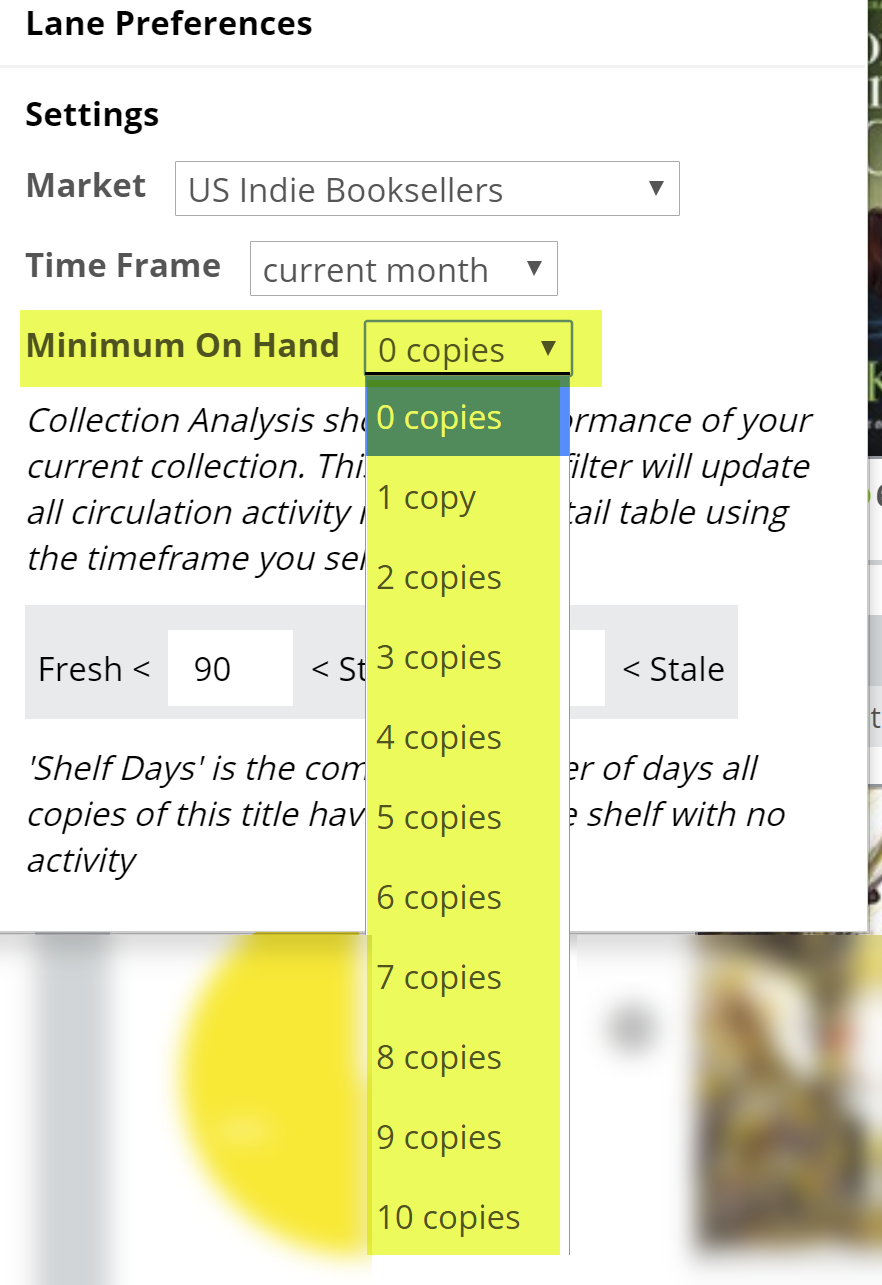
Set this to “0” to see all titles, including the titles you currently have on order. Alternately, setting the Minimum on Hand to “10” means that you’re only going to see those titles of which you have big stacks.
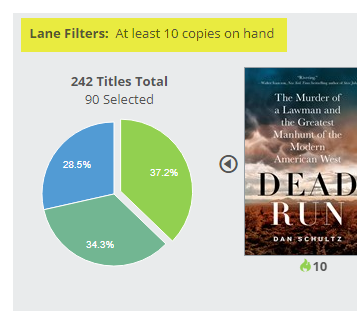
In the case above, most are doing great, but some are languishing a bit. Good information to know! It makes sense to concentrate, initially, on those titles with which you’ve made the biggest investment.
Shelf Days:
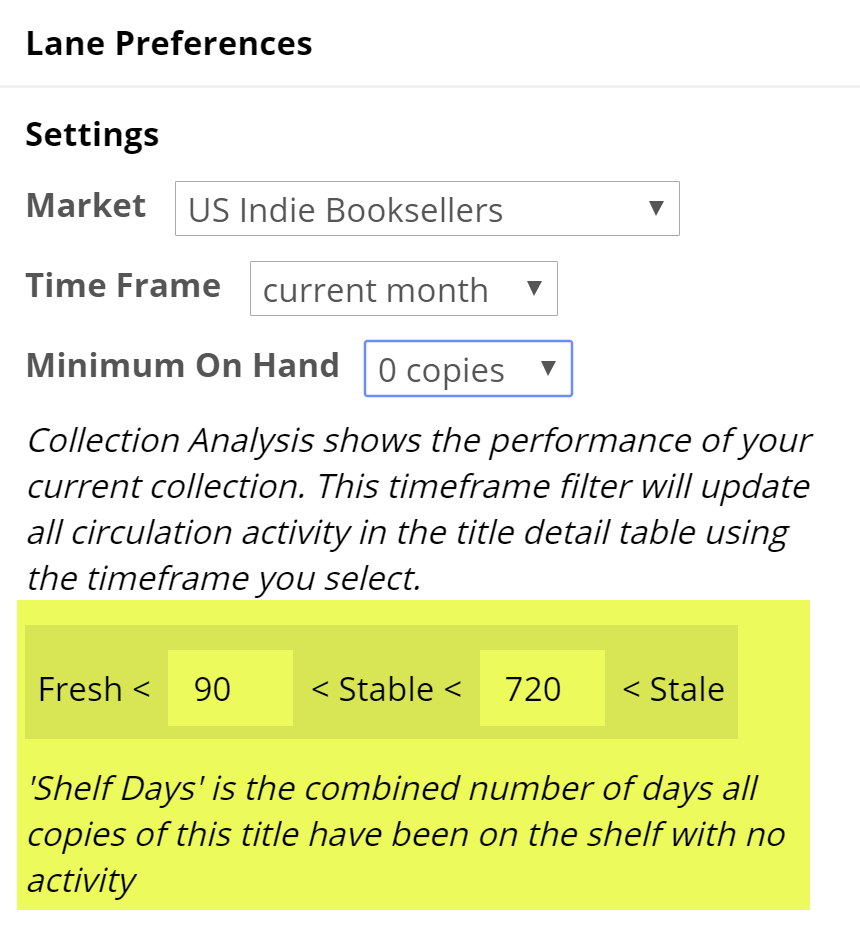
Shelf Days are fully explained here. This essentially allows you to set an upper and lower performance measure on your inventory. So, how well, and how quickly, are your titles circulating? These thresholds are incredibly relevant in this lane.